Takedown Defence: The Single Number That Reframes UFC Bets
 Available in US
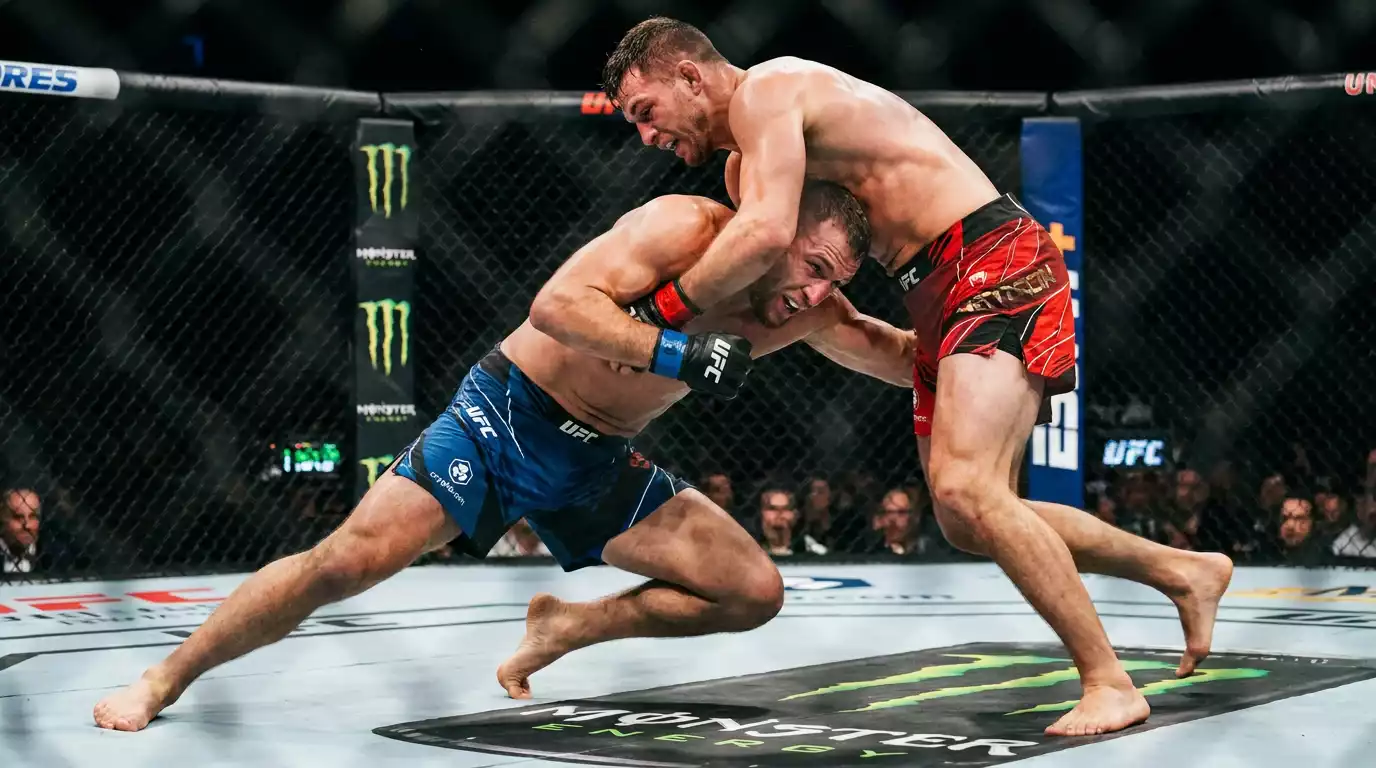
If I could keep only one statistic when reading a UFC matchup, it would be takedown defence. Significant strike differential is the headline metric most analysts cite, and it is genuinely useful. But takedown defence is the single number that most reliably reframes how a fight will actually unfold, because it determines who controls the structural question of where the fight happens.
A UFC bout that stays on the feet is a different bout from the same matchup played out on the canvas. Takedown defence is the input that decides which version of the fight you are actually betting on, and the line frequently underweights that decision relative to the moneyline narrative.
How Takedown Defence Is Measured
The standard UFC takedown defence statistic is the percentage of opponent takedown attempts that the fighter has successfully defended across his official UFC bouts. A fighter with 75 per cent takedown defence has stopped three out of every four takedown attempts against him at UFC level.
The number sounds intuitive but contains traps. The first trap is sample size. A fighter who has faced only a handful of takedown attempts across his UFC career has an unreliable percentage, and a small sample produces extreme readings in both directions that do not reflect his actual structural ability. Reading the absolute number of attempts alongside the percentage is the first discipline.
The second trap is opponent quality. Takedown defence against elite wrestlers measures something different from takedown defence against journeymen with poor takedown setups. A fighter with 80 per cent defence whose recent opponents were not serious wrestlers may be in a different actual band than the percentage suggests. The opposite holds too — a fighter with 65 per cent defence whose recent opponents were all elite wrestlers may be in better structural shape than the percentage indicates.
The third trap is direction of defence. The statistic does not distinguish between defending double-leg attempts, single-leg attempts and clinch entries to mat work. Some fighters defend one style of takedown well and another style poorly. The matchup-specific read on the takedown style the opponent prefers is more informational than the aggregate percentage.
The aggregate percentage is still the best single number for a quick read, but the reading is sharper when the punter contextualises it with opponent quality, attempt count, and takedown style.
The Three Structural Bands
UFC fighters cluster into three takedown defence bands, and each band produces different betting implications.
The elite band is 80 per cent and above. A fighter in this band keeps the fight where he wants it. If he is a striker, the fight stays on the feet, the strike output matches the camp plan, and the bout typically resolves on the feet. The moneyline price on these fighters often understates their structural control when the opponent is a wrestler the public expects to dictate the bout.
The middle band is 60 to 80 per cent. The fighter defends most attempts but gives up position regularly enough that the fight may spend significant time on the canvas if the opponent is committed to wrestling. The bout becomes a mixed-phase contest, and the betting implications depend on which phase the fighter performs better in. Some middle-band fighters are competent on the canvas and lose minimal expected value when they are taken down. Others are not, and the takedowns translate into round losses or finishes.
The compromised band is below 60 per cent. The fighter gives up position consistently against opponents with serious takedown setups. The fight goes to the canvas whenever the opponent commits to it. The moneyline price on these fighters is often shorter than their structural reality justifies because the public sees the striking record without weighting the defensive collapse against the takedown game.
The historical UFC data shows fighters with positive significant strike differential above 1.5 systematically out-finishing the field in method-of-victory markets. The same statistic interacts with takedown defence in important ways — a fighter with a high strike differential and elite takedown defence is a structurally favoured striker, while a fighter with the same strike differential but compromised takedown defence is a striker whose differential applies only to the rounds the fight stays standing.
Why the Line Underweights Defence
Takedown defence is underweighted by the betting line for three structural reasons.
The first is broadcast visibility. UFC broadcasts highlight strikes and finishes more than they highlight defensive grappling. A fighter who sprawls successfully on five takedown attempts in a round is doing extraordinary defensive work, but the broadcast may not flag it specifically. The public reads the fight on what the commentary highlights, which biases attention away from defence.
The second is stat presentation. Most UFC stat overlays during fights show strikes landed, strikes attempted and takedowns attempted. Takedowns defended are rarely displayed in real time. The viewer can do the arithmetic from the displayed numbers, but the public typically does not.
The third is intuitive narrative. The story of a fight is more easily told through what happens than through what is prevented. A successful sprawl is invisible structurally, while a successful takedown is the visible drama that the post-fight summaries lead with. The line responds to narrative attention, and the takedown defence side of the matchup gets less of it.
The combination of these three factors produces a market where elite takedown defenders are systematically slightly underpriced and compromised defenders are systematically slightly overpriced, when both face opponents with real takedown threats.
How I Apply the Number
The framework I use before any UFC bet involves three takedown-defence checks.
The first check is the headline number against the opponent’s takedown attempt rate per round. If the opponent attempts two takedowns per round on average, and the fighter has 70 per cent defence across an adequate sample, the expected takedowns landed per round is around 0.6. That number tells me how often the fight will be on the canvas.
The second check is the canvas performance of the fighter if he does get taken down. Some fighters defend takedowns at high rates but lose rounds badly when the takedown does happen. Others defend at lower rates but escape to their feet quickly enough that the canvas time does not cost them rounds. The empirical record across the fighter’s recent bouts answers this question.
The third check is the style match against the opponent’s preferred takedown entry. Single-leg specialists, double-leg specialists, clinch-to-canvas specialists, and reactive takedown shooters produce different attempts. The fighter’s defensive record against each style varies.
The three checks combined produce a structural read on how the fight will be physically contested, which then informs which markets carry value at the displayed prices. The moneyline benefits from the structural read most directly. The method-of-victory and rounds markets benefit secondarily.
For the deeper read on how method-of-victory pricing splits across the canvas-versus-standup question, the follow-on is in my walkthrough of UFC submission betting.
Takedown Defence and Submission Pricing
The interaction between takedown defence and submission pricing is one of the most useful single applications of the metric.
A fighter with takedown defence above 80 per cent rarely faces submission threats, because the submission has to start from a position the takedown defence has already prevented. Backing his opponent’s submission price, even at long odds, is structurally a poor bet unless the opponent has clinch submissions or counter-submissions available from the feet. The submission market on the fighter with elite takedown defence is essentially unbettable.
A fighter with takedown defence between 60 and 80 per cent gives up enough position for submission attempts to develop. The submission price on the opponent becomes a more interesting bet, particularly when the opponent has demonstrated submission threats in the past. The 7.00 to 12.00 price range on submission method bets is most actionable in this defensive band.
A fighter with takedown defence below 60 per cent against a true submission specialist is in structural danger that the line often underprices. The submission price on the opponent can exceed decimal 10 when the actual probability is closer to 1 in 6. This is the cleanest submission betting band, though it appears rarely because UFC matchmaking usually avoids these mismatches.
The matchups where the band-below-60 mismatch does appear are disproportionately in Cage Warriors and other regional feeder cards, where matchmaking is less polished than UFC matchmaking. The regional submission edge has been a consistent source of small but real returns across the recent calendar.
The 2025 IBIA Context
The wider integrity context for takedown defence reads has shifted alongside the broader UFC integrity wrap.
The International Betting Integrity Association recorded 300 alerts across all sports in 2025, an increase of 29 per cent on the 232 alerts from 2024, with 54 corrupted matches identified and 24 athletes sanctioned across five sports including one MMA athlete. IBIA CEO Khalid Ali framed the 2025 work as part of a wider strategic roadmap published at the organisation’s 20th anniversary.
The implication for punters reading takedown defence is that the integrity wrap monitors patterns including unusual wagering on specific markets. The takedown-defence-aware punter reads patterns through publicly available information rather than through anything that would draw integrity attention to his own account.
Stance and Takedown Defence
An overlooked input is the interaction between stance and takedown defence. The historical UFC sample shows southpaw fighters winning 53 per cent of bouts and switch-stance fighters winning 57 per cent. Some of the elevated win rates trace to favourable takedown defence dynamics created by the stance choice.
A southpaw fighter facing an orthodox wrestler presents different takedown entry angles than an orthodox fighter would. The lead-leg positioning, the hip orientation and the natural sprawl angle all favour the southpaw slightly. The aggregate effect across hundreds of UFC bouts is part of why southpaw fighters carry the win-rate edge they do.
Switch-stance fighters extend this advantage further by changing the orientation mid-bout. A wrestler who has set up his takedown attempts against an orthodox stance has to reset his approach when the fighter switches to southpaw between exchanges. The reset costs attempts. The defensive rate against switch-stance opponents is structurally higher than against single-stance opponents.
The line sometimes prices stance directly. It rarely prices the interaction between stance and takedown defence. The punter who reads both produces an integrated assessment that the operator’s model approximates but does not fully reproduce.
What the Metric Cannot See
Takedown defence has limits as a betting input, and naming them is the discipline.
The metric cannot capture in-bout fatigue. A fighter who defends takedowns at 85 per cent across 25 minutes of normal effort may defend at 65 per cent in the final two minutes of a bout he is losing on the cards. The aggregate number averages across the bout. The actual sequence-by-sequence performance can diverge.
The metric cannot capture matchup-specific preparation. A fighter who has trained for weeks against a specific wrestling style will defend against that style at higher rates than his career average suggests. The corner-specific game plan adjusts the structural number for the specific bout.
The metric cannot capture injury concealment. A fighter with a partially torn rotator cuff may defend takedowns at sharply reduced rates without disclosing the injury. The line cannot price what the public does not know. The integrity wrap captures some of these patterns through betting volume signals, but the punter rarely has direct access.
The metric is a starting point, not an endpoint. The reading that combines takedown defence with opponent attempt rate, stance, recent injury history, camp quality and matchup-specific preparation produces the structural assessment that the line approximates incompletely. The discipline is in doing the integration rather than relying on the single number.
For the natural next read, my walkthrough of southpaw stance edges in UFC betting continues the analysis at the next layer of detail.
What is a good UFC takedown defence percentage?
80 per cent and above is elite. Fighters in this band keep the fight where they want it and rarely face the canvas against any opponent. 60 to 80 per cent is the middle band where the fighter defends most attempts but gives up position regularly against committed wrestlers. Below 60 per cent is structurally compromised and produces a fight that goes to the canvas whenever the opponent commits to wrestling. The percentage should be read alongside the absolute number of attempts and the quality of the opponents who produced them, because a small sample or weak opposition can distort the headline figure in either direction.
Does takedown defence matter on UFC bouts where neither fighter is a wrestler?
Less so. A bout between two strikers with no significant takedown threats means the takedown defence statistic has limited relevance because the takedowns that the defence would prevent are not being attempted at meaningful rates. The structural value of the metric increases as the opponent’s takedown attempt rate increases. On striker-versus-striker bouts the more informational metrics are usually significant strike differential, output rate per round, and stance interactions — particularly the elevated win rates for switch-stance fighters at 57 per cent and southpaws at 53 per cent across the historical UFC sample.
Published by the Betting mma team.